
Business Report
Financial Data
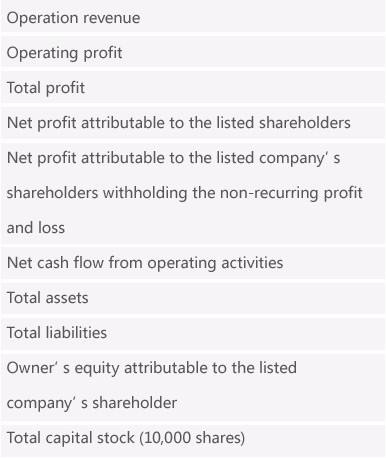
Main Accounting Data
Items

2020
Increase or decrease
compared with last year
Main Financial Indexes
Main Financial Indexes
Basic EPS (RMB)
Net cash flow from operation per share (RMB)
Weighted average return on equity
Asset-liability ratio
Quick ratio
Turnover rate of accounts receivable
Inventory turnover rate
Gross profit rate
20202019
Dividend Policy
| Dividend year | Distribution policy | Cash dividend amount (RMB 10,000) | Ratio of the net profit attributable to the listed company’s shareholder in consolidated statement |
|---|---|---|---|
| 2020 | RMB 7.0 distributed per 10 shares (including tax) | 1,106,714,388 | 72.61% |
| 2019 | RMB 3.6 distributed per 10 shares (including tax) | 569,697,319 | -160.08% |
| 2018 | RMB 5.0 distributed per 10 shares (including tax) | 734,408,940 | 73.28% |
| 2017 | RMB 3.3 distributed per 10 shares (including tax) | 484,859,720 | 63.28% |
| 2016 | RMB 2.6 distributed per 10 shares (including tax) | 382,283,688.8 | 71.43% |
| 2015 | RMB 6 distributed upon addition of 10 shares (including tax) | 436,806,564 | 68.73% |
| 2014 | RMB 5 distributed per 10 shares (including tax) | 364,005,470 | 72.43% |
| 2013 | RMB 10 distributed upon addition of 10 shares (including tax) | 328,080,000 | 77.8% |
| 2012 | RMB 6 distributed upon addition of 5 shares (including tax) | 131,232,000 | 46.81% |
| 2011 | RMB 10 distributed upon addition of 10 shares (including tax) | 109,360,000 | 58.66% |
| 2010 | RMB 10 distributed upon addition of 10 shares (including tax) | 546,800,000 | 59.37% |